TL;DR
MOIC calculation (Multiple on Invested Capital) measures total value relative to paid-in capital (cumulative contributions. For family offices tracking multiple private equity funds across entities, calculating MOIC requires aggregating cash flows and storing valuations with precise dates.
From Statements to Decisions with MOIC
Your family office has committed $50M across eight private equity funds. Each sends quarterly statements (capital account/partner statements) showing contributions (paid-in capital), distributions, and quarter-end Net Asset Value (NAV)
Now, you need to answer:
- Which investments are performing?
- What's our blended return?
- Should we commit more to this manager?
- What’s our realised vs unrealised MOIC?
The answer requires MOIC calculation. MOIC stands for Multiple on Invested Capital. MOIC is widely used in private markets as a simple value multiple, typically reviewed alongside IRR (and sometimes PME) to account for timing.
Sounds straightforward. But it’s rarely that simple for family offices to calculate.
Most families track this in spreadsheets, manually updating when statements arrive. Capital calls get entered. Distributions get recorded. Valuations get copy-pasted. The MOIC calculation formula gets applied.
Six hours later, you have numbers, but private market data is often a quarter behind, and you’re not confident everyone’s reporting on the same basis.
This guide shows how family offices accurately track MOIC across multiple investments using operational infrastructure that systematically handles the complexity.
Why MOIC Matters for Family Offices
Family offices use MOIC calculation for four critical purposes:
- Principal and investment committee reporting: Principals want simple answers. "Is Fund X performing well?" MOIC provides that clarity. A 2.5× MOIC means total MOIC (cash distributed + remaining fair value) equals $2.50 per $1 of paid-in capital. MOIC expectations vary by strategy, vintage, and market conditions; mature buyout funds tend to have a lower MOIC, while VC outcomes can be more dispersed.
- Manager comparisons: You've invested with three different private equity firms in similar vintages. Which delivered better investment performance? Calculating MOIC consistently across managers reveals the answer. But consistency is key—comparing gross MOIC from one fund against net MOIC from another is meaningless.
- Partial realizations: When a private equity fund sells one portfolio company while holding others, how does that affect MOIC? The realized value flows out as distributions. Unrealized value in remaining holdings gets revalued. Your MOIC in private equity rises with successful exits but can fall if remaining assets get marked down. Tracking these movements requires capturing each transaction and revaluation.
- Commitment pacing: Understanding MOIC across your current portfolio informs future commitments. If your 2019 vintage funds are generating 3.0× MOIC while 2021 vintage funds show 1.2×, that affects how you think about deploying capital to similar strategies today.
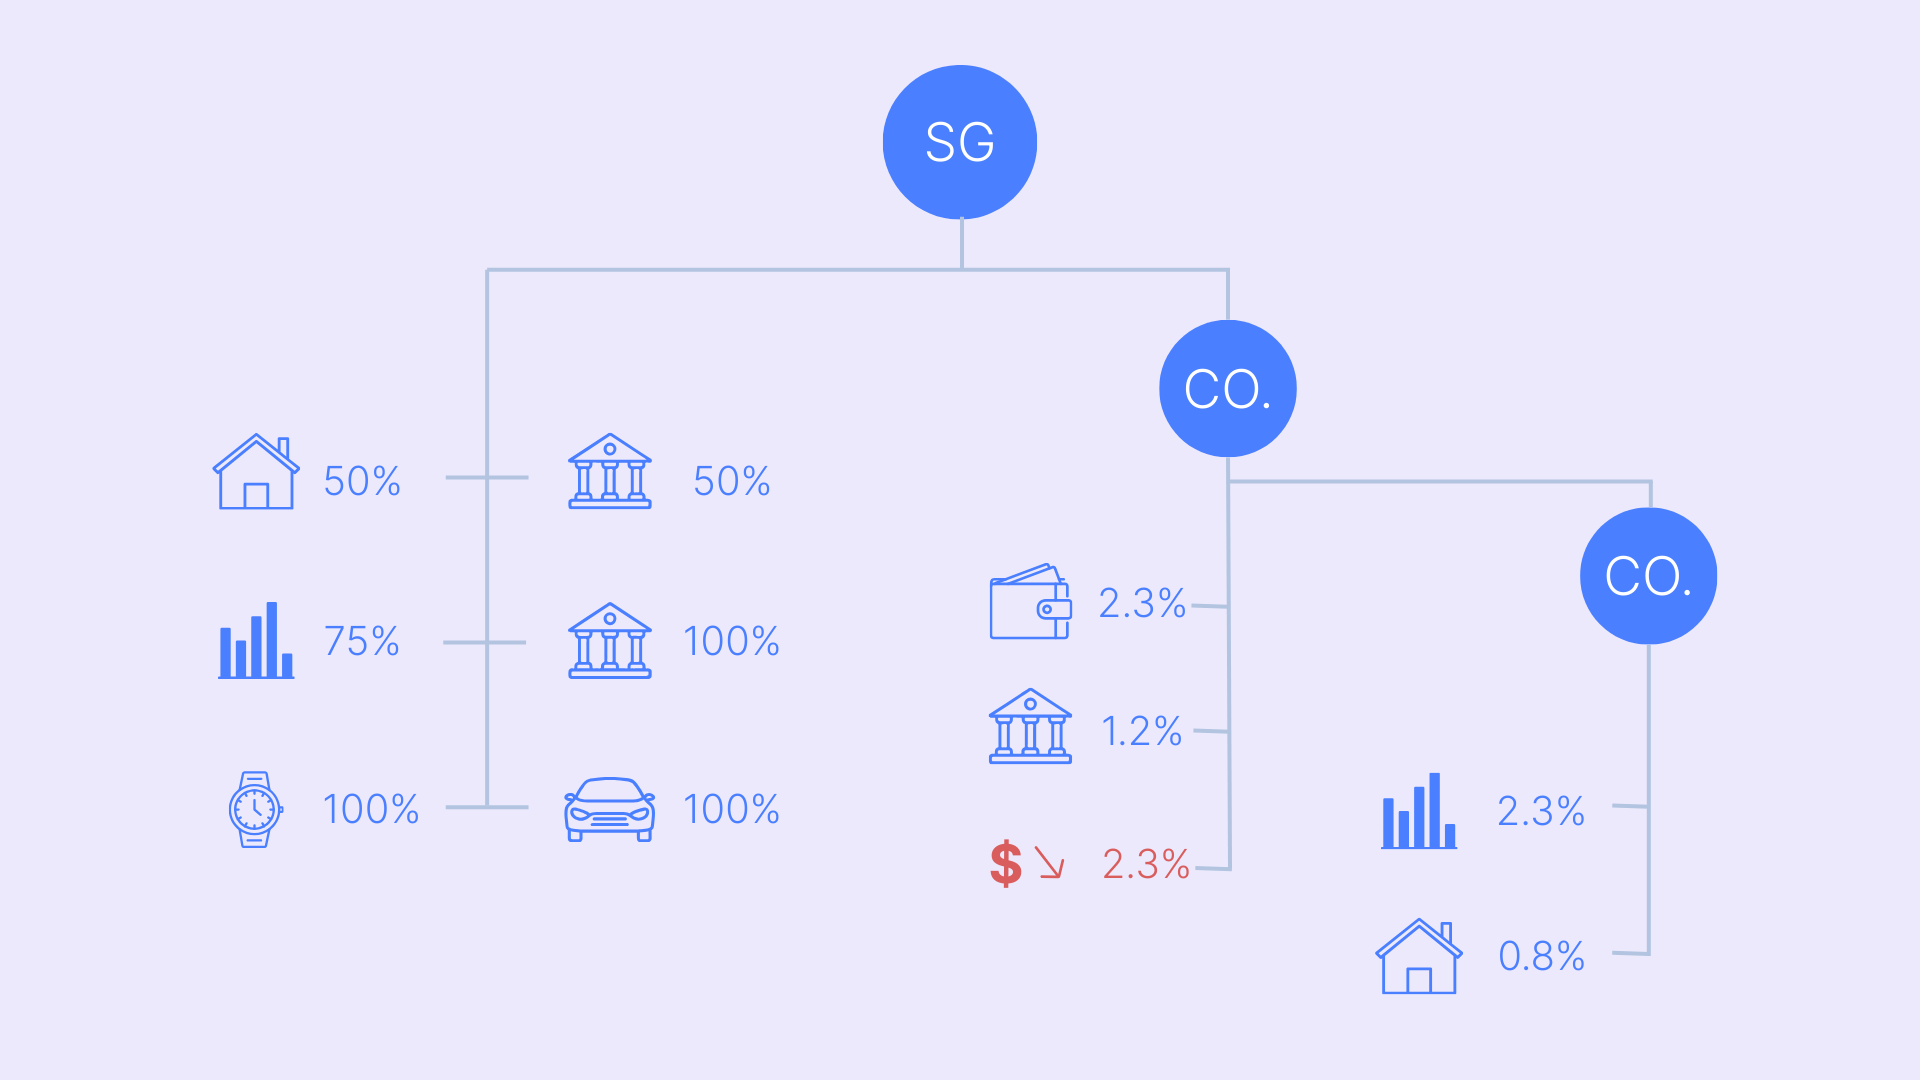
For family offices managing multiple entities, the complexity of the MOIC calculation multiplies. That private equity investment might sit in three different trusts, each with a different ownership percentage. Capital calls and distributions flow through entity structures to ultimate owners. You need MOIC at both the holding level and rolled up to the owner level.
Getting this right requires clear MOIC definitions:
- Net-to-LP MOIC (recommended default) uses the numbers the LP actually experiences. It’s calculated as (distributions received + current NAV) divided by paid-in capital, using GP or fund administrator statements, so it reflects fees, fund expenses, and carried interest.
- Gross MOIC is a pre-fee multiple and should only be used if you can define and source it consistently. If you track it, state explicitly what “gross” means in your reporting (for example, underlying asset level performance before fees and carry) and note that it may require GP-provided look-through data.
The difference matters. Fees and carry can materially reduce investor multiples; quantify using fund-specific terms and explicitly state whether you’re using net-to-LP statement figures
Family offices need regular updates that show current Net-to-LP MOIC, saved views comparing managers and vintages, and variance reviews that explain why MOIC changed month over month. Use monthly monitoring for cash flows, commitments, and FX. Treat valuations as quarterly, and always disclose the latest NAV as-of date clearly.
This operational cadence turns MOIC from a quarterly archaeology project into routine management information.
10 Ways to Track MOIC Across Multiple Investments
1. Unify Cash Flows and Valuations Across Entities
MOIC calculation starts with complete, accurate data on what went in (capital contributions) and what's out or remaining (distributions plus current value). When these cash flows and valuations scatter across multiple banks, and GP/admin sources (and any custody/platform provider, where applicable), the calculation becomes guesswork.
Family office data aggregation automates bank transaction capture, then makes it easier to reconcile cash flows against capital call and distribution notices and LP statements, with GP or fund administrator documents treated as the source of truth for NAV.
Store and standardize cash flows:
- Contributions (capital called and paid)
- Distributions (cash returned to investors)
- Fees as part of capital call components (management fees and fund expenses)
- Carried interest reflected in net distributions and NAV (and where available, accrued carry), rather than as a standalone payment line in most cases
Each transaction needs its as-of date and settlement status.
Track valuations separately with clear provenance: GP or fund administrator reported NAV with the as-of date (often quarter-end) clearly stated, independent third-party appraisals for direct holdings where applicable, and reported valuations for illiquid assets (for example real estate or private company positions) with the valuation method and key assumptions documented.
Map everything to the correct entity using an ownership/entity Map. If Trust A owns 60% of the family's LP interest in Fund X and Trust B owns 40%, capital calls and distributions must flow to the appropriate entity to ensure accurate per-entity MOIC calculation.
Deliverable: One single source of truth showing capital in, capital out, and current value per holding and per owner.
2. Standardize Gross MOIC and Net MOIC Rules
The MOIC formula is simple: (Distributions + Current Value) / Invested Capital. But what exactly goes in each component? Without clear rules, your MOIC calculation produces inconsistent results across investments.
Define inclusions and exclusions explicitly:
- Do management fees reduce invested capital or not?
- Are fund expenses (legal, audit, admin) included?
- How do you treat carried interest, as an expense reducing net MOIC, or excluded for gross calculation?
- What about deal expenses charged to specific investments?
- Do subscription line effects (short-term fund borrowing) affect timing?
- Does recycling (reinvesting proceeds into new deals) change invested capital?
- How do you handle tax withholding on distributions?
Document your policy clearly. Most family offices calculate both gross and net:
- Gross MOIC: Invested capital equals capital contributions only (excluding fees). Total value equals distributions plus NAV (excluding any fee accruals or carry provisions). This shows the fund's investment performance before costs.
- Net MOIC: Invested capital includes all capital called, including fees. Total value uses net-of-carry distributions and net NAV (after all fee accruals and carry provisions). This shows actual investor returns.
Track fees and carry, so net MOIC calculation pulls the correct figures. Store fee schedules and carry terms from Limited Partnership Agreements (LPAs) linked to each fund investment.
Deliverable: Saved calculation fields for gross and net MOIC across all holdings. Your monthly reports show both multiples consistently calculated, letting you compare investment success across different private equity funds using the same methodology.
3. Handle Partial Exits and Follow-On Rounds
MOIC calculation gets complicated when fund activity changes the basis. A partial exit when the fund sells one portfolio company generates a distribution but leaves the remaining holdings. A follow-on round, when you invest more capital into an existing fund, increases the invested capital.
- Log tranches and realizations: Track each distinct capital deployment as a separate lot or tranche. Initial commitment of $5M in 2020. Follow-on opportunity commitment of $2M in 2022. Each has different vintage characteristics affecting return expectations.
- When partial exits occur, recalculate: If a fund with $5M paid in capital and $8M current value (1.60× MOIC) sells assets generating $3M distribution while remaining holdings get marked to $6M, your new MOIC is ($3M distributions + $6M value) / $5M capital = 1.80×. The realized value plus remaining unrealized value divided by the total initial investment.
- Track basis adjustments: Some LPAs allow the return of capital distributions that reduce the capital initially invested for future MOIC calculations. Others treat all distributions as returns on investment, not returns of investment. Know which applies to each fund.
Deliverable: MOIC snapshots by as-of date that preserve valuation date, foreign exchange (FX) convention, and transaction history. You can show MOIC as of Dec 31, compared to Sept 30, and explain exactly what changed: new capital called, distributions received, asset sales, or valuation adjustments.
4. Link Documents to the Initial Capital and Investment Performance
MOIC calculation depends on accurate source data from capital account statements, LPAs defining fee and carry terms, and valuations from appraisals or GP reports. When these documents live in email or shared drives, verification takes hours.
Store LPAs, side letters, appraisals, and capital account statements in Documents. Tag by fund, vintage, and document type for easy search.
Link each file to the relevant holding and the specific transaction or valuation record used in calculating MOIC. When your report shows "Fund Y at 2.3× MOIC based on Q3 NAV," the supporting capital account statement should be one click away.
This matters for disputes or questions. Did the GP's Q4 valuation actually arrive, or are you using Q3 numbers? What were the fee terms affecting the net MOIC calculation? The evidence sits next to the numbers.
Deliverable: A "docs at hand" view from each position and report. Auditors, investment committees, and principals can verify MOIC calculations instantly by accessing source documents directly from the report line.

5. Track Commitments, Unfunded, and Pacing for Alts
MOIC calculation looks backward (how did investments perform), but commitment tracking looks forward (what capital calls are coming). These connect because high MOIC on existing funds might justify additional commitments to that manager.
- Use private assets to register all commitments: total commitment amount, capital called to date (paid in capital), and unfunded commitment remaining.
- Track known calls when capital call notices arrive: Flag these in your cash flow forecast for the next 6–9 months. Use pacing assumptions (clearly labeled as estimates) for funds likely to call, but where timing is uncertain.
- Connect this to MOIC context: If a private equity fund is showing 2.8× MOIC on $4M invested with $1M unfunded commitment remaining, you're likely committing that final $1M. If a fund shows 0.9× MOIC two years in, you might consider whether to default on the remaining commitment (though this carries severe relationship consequences).
Deliverable: A commitments and pacing panel that keeps MOIC performance visible alongside capital deployment obligations. Follow-on decisions improve when past performance (MOIC) and future requirements (unfunded commitments) sit side by side.
6. Convert FX and Set a Home-Currency View
Family offices with international private equity exposure face foreign currency complications in MOIC calculation.
Store base currency at the owner or portfolio level. For US-based families, that's typically USD. For European families, EUR.
Calculate MOIC in reporting currency using defined FX conventions:
- Transaction-date FX for cash flows (contributions and distributions convert at rates on the dates they occurred)
- Valuation-date FX for ending value (current NAV converts at the rate as of the valuation date)
- Document hedging treatment if applicable (some funds hedge currency risk; others don't)
This creates consistent MOIC across multi-currency holdings. Without it, you're mixing EUR multiples and USD multiples, making comparisons meaningless.
Deliverable: Consistent, currency-aware MOIC across multi-currency holdings.
7. Compare Managers and Vintages Consistently
You've invested across multiple fund managers in different vintage years. Which consistently delivers superior investment returns? This comparative analysis requires systematically grouping and calculating MOIC.
Group by manager, fund, strategy (buyout versus growth equity versus venture capital), and vintage year. Calculate gross and net MOIC for each cohort using the same methodology.
When monitoring your performance, you should see these comparisons with drill-downs to underlying transactions and documents. If Manager A shows 2.8× average MOIC across three funds while Manager B shows 2.1×, you can drill into specific funds explaining the difference.
Consider context: A reasonable MOIC multiple varies by strategy. Venture capital funds might show binary outcomes; some deliver 5.0× MOIC, others 0.3×. Buyout funds cluster tighter around 2.0–2.5×. Growth equity falls between. Compare within strategy, not across.
Deliverable: A manager-and-vintage comparison view that the board can scan in minutes.
8. Add Variance Review to Monthly Reporting
MOIC changes every month as funds call capital, make distributions, and revalue holdings. Understanding why MOIC moved matters as much as knowing the current number.
Build monthly cash flow reporting and quarterly valuation cycles for private assets. Use timely updates where available.
Monitor with a monthly movement bridge, breaking changes into defined buckets:
- Cash flows: new capital called increases the denominator (reducing MOIC temporarily); distributions increase the numerator (increasing MOIC)
- Valuation changes: mark-ups increase the numerator (improving MOIC); mark-downs decrease it
- FX movements: currency shifts affect both the numerator and the denominator for foreign investments
- Fees and expenses: fee payments reduce net value, affecting net MOIC
- Clearly defined residuals: anything not categorized above
Save a "review flags" view highlighting significant changes.
Deliverable: A monthly snapshot showing where MOIC moved and why.
9. Advisor Reports and Board-Ready Outputs
Investment committees, external advisors, and principals need MOIC information in different formats. Some want detailed fund-by-fund breakdowns. Others want high-level summaries. All need consistent data.
Save standard views showing:
- Portfolio summary: total private equity investments, blended MOIC, gross versus net
- Manager comparison: MOIC by manager with vintage grouping
- Entity breakdown: MOIC performance by trust or holding company
- Strategy analysis: MOIC by investment strategy (buyout, growth, VC, real estate)
Schedule advisor and board reports for automatic export. Follow family office reporting best practices with consistent formats and regular cadence.
Following automated reporting in wealth management principles means these reports are generated on schedule with current data (not requiring manual recreation each month).
Deliverable: Repeatable outputs that keep MOIC updates timely and consistent. Board members receive the same report format quarterly, making period-over-period comparisons straightforward.
10. Make On-the-Go Checks with MFA
Principals travel frequently and need to check private equity performance during meetings. Use mobile wealth management with multi-factor authentication (MFA) for secure access. Surface saved views showing current MOIC across funds, upcoming capital calls, and recent valuation updates.
Provide quick lookups: total private equity portfolio MOIC, individual fund performance, and liquidity obligations from upcoming calls. Task lists flag items requiring principal attention.
Deliverable: Secure mobile access to MOIC and liquidity context when decisions can't wait. Principals make informed decisions about new commitments or co-investment opportunities based on current portfolio performance.
MOIC (TVPI) — Formula & Examples
The MOIC investment calculation formula is simple:
MOIC = (Cumulative Distributions + Residual Value) / Paid-In Capital
Total MOIC is often referred to as TVPI (Total Value to Paid-In). The terms are used interchangeably in private equity.
Components:
- Cumulative Distributions: Total cash returned to investors (also called DPI—Distributed to Paid-In)
- Residual Value: Current fair value of remaining holdings (also called RVPI—Residual Value to Paid-In)
- Paid-In Capital (PIC): Total capital contributions made by investors
Note: DPI + RVPI = TVPI = MOIC. These multiples relate to each other systematically.
Gross vs. Net
Gross MOIC excludes fees, expenses, and carried interest. It shows how much value the fund's investments generated before costs. Calculate using:
- Paid-In Capital = capital contributions only (excludes fees)
- Distributions = gross distributions before carry
- Residual Value = gross NAV before carry accrual
Net MOIC includes all costs. It shows actual investor returns after fees and carry. Calculate using:
- Paid-In Capital = all capital called, including management fees and fund expenses
- Distributions = net distributions after carried interest
- Residual Value = net NAV after all fee accruals and carry provisions
MOIC calculation example: A private equity fund calls $5.0M capital from your family office over three years. The fund distributes $3.0M from portfolio company exits. The current NAV of the remaining holdings is $4.5M.
How to calculate net MOIC: MOIC = ($3.0M + $4.5M) / $5.0M = 1.5×
This breaks down as:
- DPI (Distributed to Paid-In) = $3.0M / $5.0M = 0.60×
- RVPI (Residual Value to Paid-In) = $4.5M / $5.0M = 0.90×
- TVPI (Total Value to Paid-In) = DPI + RVPI = 1.5×
The fund has returned 60% of invested capital in cash and holds assets worth 90% of invested capital, for a total value of 1.5× initial capital invested.
Investment portfolio calculation:
When calculating MOIC across multiple investments, sum at the holding level and don't average multiples. If you have three funds:
- Fund A: $2M invested, $5M total value = 2.5× MOIC
- Fund B: $3M invested, $6M total value = 2.0× MOIC
- Fund C: $5M invested, $8M total value = 1.6× MOIC
Portfolio MOIC = ($5M + $6M + $8M) / ($2M + $3M + $5M) = $19M / $10M = 1.9×
Not the average of (2.5 + 2.0 + 1.6) / 3 = 2.03×. Always sum values and sum capital, then divide.
You can also express this as a paid-in-capital weighted average of holding-level MOICs:
Portfolio MOIC = (2.5× × $2M + 2.0× × $3M + 1.6× × $5M) / ($2M + $3M + $5M)
= ($5M + $6M + $8M) / $10M = 1.9×
Show both gross MOIC and net MOIC using consistent rules across all holdings. This reveals how much value fund managers capture through fees and carry, versus delivering to investors.
How Asora Supports MOIC Calculation End-to-End
Calculating MOIC across multiple private equity investments and entities requires integrated infrastructure. Here's how Asora supports the complete workflow:
- Data Aggregation: Connect multiple banks and custodians with timely feeds. Store normalized cash flows with transaction dates and currencies. Aggregate data across entities for complete capital flow visibility.
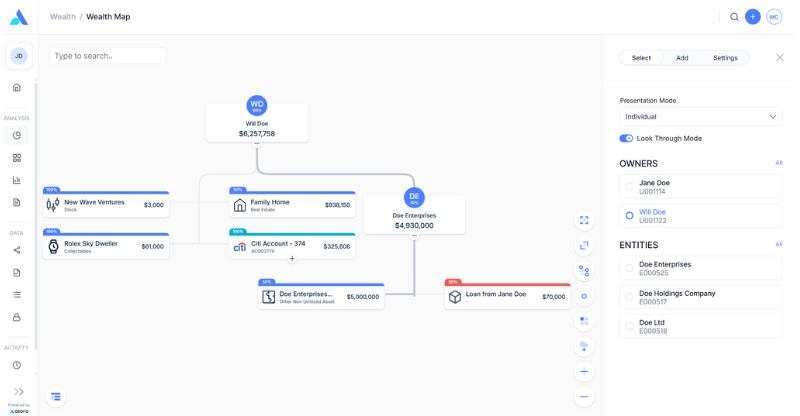
- Wealth Map: Chart ownership structure across trusts, SPVs, and holding companies. Link every cash flow and valuation to the correct entity and ultimate owner. Calculate owner-level MOIC, showing how each family member's or trust's positions performed.
- Private Assets: Register commitments and track unfunded amounts. Record calls and distributions as they occur. Handle partial exits and co-investment tranches with separate lot tracking. Store current NAV and valuation dates. Link the LPAs and side letters that document fee terms and carry provisions.
- Accounting: Track invested capital by lot and tranche. Maintain realized and unrealized gains. Capture fees and carry properly, distinguishing gross versus net treatment. Calculate MOIC at the holding level and roll up to portfolio and owner levels.
- Performance Monitoring: Calculate Time-Weighted Return (TWR) for liquid portfolios and Internal Rate of Return (IRR) for private investments. Build monthly movement bridges, breaking MOIC changes into flows, valuation adjustments, FX movements, and other factors. Save review-flags views highlighting significant drivers.
- Documents: Secure vault for capital account statements, LPA fee schedules and carry provisions, appraisals, and valuations. Link documents to specific holdings and report lines. Enable secure external uploads from fund GPs and administrators.
- Workflows: Create tasks for capital call processing, valuation updates, and GP report reviews. Assign owners, set due dates, capture reviewer notes at the holding level; workflow support for coordination without automation.
- Reporting: Build saved MOIC views showing gross and net multiples by manager, vintage, strategy, and entity. Export monthly owner snapshots and quarterly deep-dive reports. Select currency for consistent cross-border reporting.
Private equity portfolio management software becomes essential when tracking MOIC across 8–15 fund relationships with quarterly reporting cycles and complex entity structures. The alternative (spreadsheets and manual reconciliation) doesn't scale as commitment activity increases.
.png)
Conclusion
Calculating MOIC across multiple private equity funds and entities requires more than knowing the MOIC formula. You need complete cash flow data, precise gross-versus-net rules, tranche-level tracking for partial exits, currency conversion for international investments, and systematic variance analysis explaining changes.
Clarity and cadence beat complexity. To make the MOIC calculation routine:
- Step 1: Aggregate cash flows and valuations across banks and custodians. Draw the ownership map showing how investments sit within trusts and entities so that each contribution, distribution, and valuation lands with the right owner.
- Step 2: Set up the commitments register. Document your fee and clearly carry the rules. Calculate both gross MOIC and net MOIC at the holding level, then roll up to portfolio and owner levels using summed values, not averaged multiples.
- Step 3: Save a monthly movement bridge explaining why MOIC changed. Build saved MOIC views for managers, vintages, and entities. Schedule quarterly deep-dive reports for investment committees. Export owner snapshots showing individual trust or entity performance.
When MOIC is tracked this way, follow-on investment decisions improve because performance evaluation, commitment pacing, and manager comparison all use consistent, current data. Numbers and supporting evidence sit side by side.
High MOIC indicates a successful investment. Low MOIC signals underperformance requiring attention. But you can only make these judgments with accurate, timely MOIC calculation across all investments using a consistent methodology.
Request a demo to see MOIC calculations, commitment tracking, and reporting running on one platform. We'll walk through your specific situation and show how Asora handles the operational complexity of tracking multiple invested capital across private equity and venture capital portfolios.
FAQ
What's the difference between gross MOIC and net MOIC?
Gross MOIC excludes management fees, fund expenses, and carried interest, showing investment performance before costs. Net MOIC accounts for all fees and carry, showing actual investor returns.
How does MOIC differ from IRR for evaluating investment performance?
MOIC measures total value generated regardless of timing (cash on cash return), while Internal Rate of Return (IRR) incorporates the time value of money. A fund returning 3.0× MOIC over three years has better IRR than the same MOIC over ten years. Use MOIC for simple comparative analysis across funds. Use IRR when timing matters.

.png)